Dell: Levered to the Cycle on Every Axis
Customer loans, inventory, supplier credit and purchase commitments are all growing in the same direction. When the AI cycle turns, they compound.
Point-in-time note. Prices are as of October 23, 2026 and estimates as of October 24, 2026. Financials are from fiscal Q2 FY27 (May–Jul 2026) filings. Figures are not updated after publication.
Dell's AI boom is real, but its balance sheet is now levered to that boom on every axis at once. When the cycle turns, these exposures compound rather than offset.
DELL at $456 · FY28 consensus EPS $16.39 low, $29.93 mean, $36.47 high · multiple held at 15x
What the filings show
What the filings show for fiscal Q2 FY27 (May–Jul 2026):
- Dell is financing its own revenue. Revenue booked up front on Dell-financed leases was $3.7B in the quarter, versus $181M a year earlier and $886M in all of FY26. Financing receivables jumped $6.5B in that single quarter.
- The weakest borrowers are growing fastest. Loans in Dell's lowest internal credit tier rose from $1.8B to $4.4B in six months, and loan-loss provisions rose elevenfold.
- The headline cash flow is mostly add-backs. Adjusted free cash flow of $8.1B was 88% add-backs. Reported operating cash flow was $2.2B, against net income of $4.1B.
- Suppliers are funding the build. Payables rose $16.2B in six months. Strip out supplier credit and customer prepayments, and first-half operating cash flow was about −$13B.
- Inventory doubled at the top of the memory cycle. Inventory reached $21.3B, with another $34.8B of purchase commitments. Traditional server revenue grew 122%, mostly on price.
- Earnings quality is deteriorating faster than peers. On the Alphatica earnings quality score, Dell fell from 63 to 30 (out of 100) in two quarters. Against hardware peers it fell from 90 to 26.
- Sentiment is stretched, and major holders are selling. The stock is up 263% year to date after peaking at +367%. Shorts have covered, no analyst rates it a sell, and the Dell Foundation and Silver Lake sold several billion dollars of stock into the rally.
This is not an accounting-fraud call. PwC's opinion is clean, the 2025 material weakness is remediated, and non-GAAP adjustments are moderate. It is a call that the earnings and cash flow the market is capitalizing depend on conditions that can reverse quickly, and that the risk sits in footnotes most investors don't read.
Dell is financing its own revenue
In fiscal Q2 FY27, Dell booked $3.7B of revenue on leases it financed itself, four times its total for all of FY26. Under sales-type lease accounting, Dell recognizes the product sale up front and carries the customer's payments as a receivable on its own balance sheet.
| Period | Revenue on Dell-financed sales-type leases | Gross margin on it |
|---|---|---|
| Q2 FY27 (May–Jul 2026) | $3,711M | $467M |
| Q2 FY26 (May–Jul 2025) | $181M | $3M |
| FY26 full year | $886M | $88M |
| FY25 full year | $1,992M | $289M |
The loan book followed. Net financing receivables were flat in fiscal Q1, then jumped $6.5B in Q2 alone:
| Date | Financing receivables, net | Lowest credit tier (gross) | Lowest tier, % of book |
|---|---|---|---|
| Jul 31, 2026 | $20.4B | $4.4B | 21.5% |
| Jan 30, 2026 | $14.3B | $1.8B | 12.7% |
| Jan 31, 2025 | $11.2B | $1.3B | ~12% |
The new money is going to weaker credits. Loans in Dell's lowest internal grade made up 31% of FY27 originations so far, about double the FY26 share. Dell raised its loan-loss provision to $122M in Q2 from $11M a year earlier.
Dell does not name the borrowers. Management describes neoclouds (GPU cloud providers) as the largest dollar buyers in its AI backlog and promotes Dell Financial Services as a differentiator for them. In September, the CFO said Dell would not use its balance sheet for long-term neocloud financing. The Q2 numbers are hard to reconcile with that, though they don't prove who the borrowers are.
Vendor financing in a hardware boom has a history. Lending to customers so they can buy your product inflates demand on the way up and turns into losses and cancelled orders on the way down.
Adjusted free cash flow is mostly add-backs
Dell reported $8.1B of adjusted free cash flow in Q2 FY27, but $7.2B of it was add-backs for the loans and leases Dell itself financed. Reported free cash flow was $1.0B.
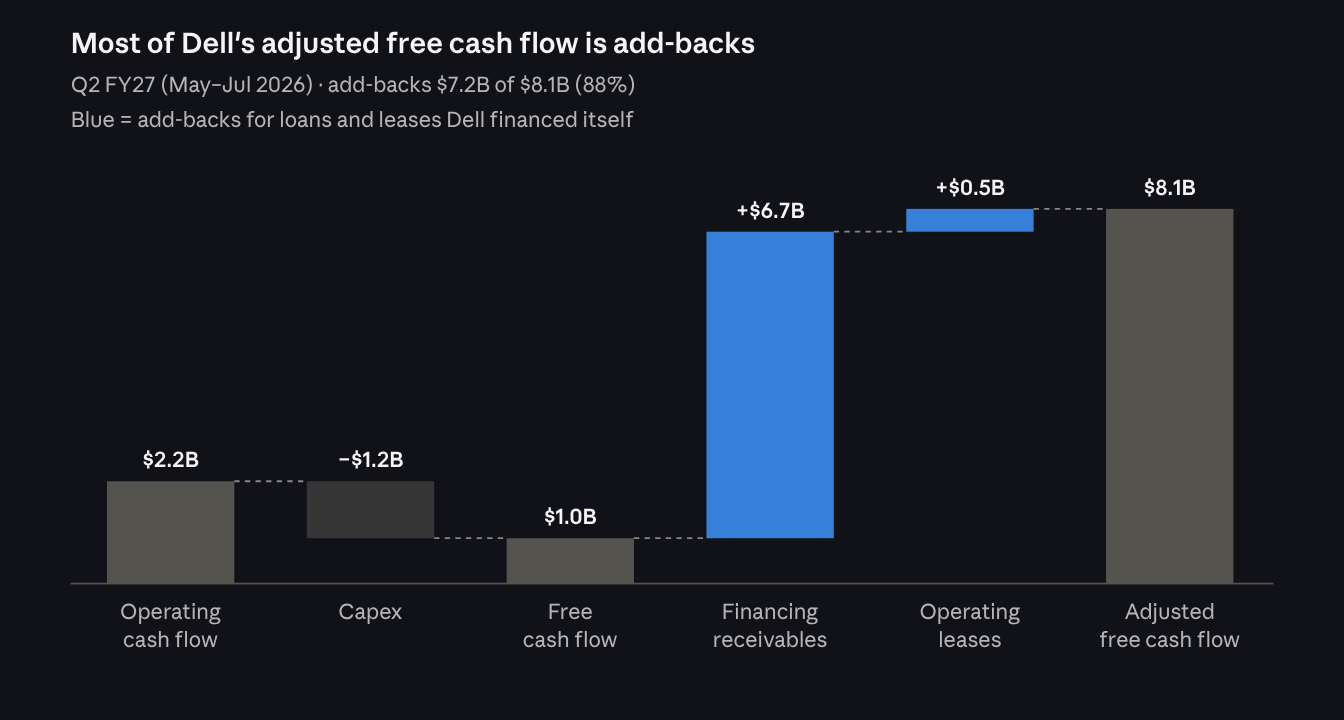
Dell's rationale is that the cash it lends to customers is "largely subsequently replaced" by asset-backed DFS debt, so the outflow is a timing difference. The filings say otherwise. Since January 2025, the loan book has grown much faster than the debt that is supposed to fund it:
| Date | DFS debt | Financing receivables, net | DFS debt / receivables |
|---|---|---|---|
| Jul 31, 2026 | $9.6B | $20.4B | 47% |
| Jan 30, 2026 | $9.1B | $14.3B | 64% |
| Jan 31, 2025 | $8.7B | $11.2B | 78% |
In the first half of FY27, receivables grew $6.2B while DFS debt grew $0.5B. The gap is funded by Dell's corporate balance sheet. Over the same six months, total debt rose $3.0B to $34.7B, Dell bought back $5.4B of stock, and shareholders' equity stayed negative at −$1.4B.
Dell's own 10-Q cautions that the measure does not reflect debt service or other contractual commitments, and is not cash available for discretionary use. Yet it is the figure Dell uses in its capital allocation framework, and the one that funds the buyback narrative.
Suppliers are funding the cash flow
In the first half of FY27, Dell's working-capital build used $22.7B of cash, and suppliers and customer prepayments supplied $19.3B of it. Reported operating cash flow of $6.3B sits on top of that swing.
| Selected cash flow lines, H1 FY27 (Feb–Jul 2026) | Cash impact |
|---|---|
| Accounts payable | +$16.2B |
| Deferred revenue | +$3.1B |
| Inventories | −$10.9B |
| Financing receivables | −$6.4B |
| Accounts receivable | −$5.4B |
| Operating cash flow (reported) | +$6.3B |
Excluding the payables and deferred-revenue inflows, first-half operating cash flow was roughly −$13B. That is not a problem while growth continues. When growth slows, payables shrink faster than inventory and receivables can be collected, and the inflow reverses.
The flattering effect is already visible in the earnings quality metrics. Because payables rose with inventory, standard accrual ratios make Dell look cash-backed. In Q2 alone, though, net income of $4.1B exceeded operating cash flow of $2.2B.
This is ordinary trade credit, not financial engineering. Dell's supply chain finance program, where suppliers sell their Dell invoices to a bank, held $3.1B of the $49.7B in payables at July 31. Disclosed maximum payment terms under the program were shortened from 130 days to 100 days in the FY26 10-K.
| Date | Days sales outstanding | Days inventory | Days payables |
|---|---|---|---|
| Jul 31, 2026 | 44 | 52 | 122 |
| May 1, 2026 | 54 | 38 | 114 |
| Jan 30, 2026 | 48 | 36 | 115 |
Inventory days of 52 are the highest in more than 20 years of Dell's quarterly data. Days are measured on quarter-end balances against quarterly revenue and cost of revenue.
Inventory doubled at the top of the memory cycle
Dell's inventory doubled to $21.3B in six months, and most of the increase is raw components bought during a memory price spike. Raw components ("production materials") went from $6.7B to $15.9B.
| Date | Production materials | Work in process | Finished goods | Total inventory |
|---|---|---|---|---|
| Jul 31, 2026 | $15.9B | $4.2B | $1.2B | $21.3B |
| Jan 30, 2026 | $6.7B | $2.8B | $1.0B | $10.4B |
| Jan 31, 2025 | $4.4B | $1.1B | $1.2B | $6.7B |
On top of that, Dell has $34.8B of purchase obligations (the non-cancelable portion of its supplier contracts), $22.4B of them due in the rest of FY27. Management says it "increased our purchases of certain components," and expects component inflation to persist through the fiscal year.
Part of the revenue surge is that same inflation passing through. Traditional server and networking revenue rose 122% in Q2. The 10-Q attributes the increase primarily to higher average selling prices from "disciplined pricing," not to units. When memory prices turn, Dell faces lower selling prices on one side and high-cost inventory and commitments on the other.
A second signal sits in the warranty reserve. Dell's standard warranty liability went from $450M in January to $1,207M in July. First-half warranty accruals were $1,202M, versus $460M a year earlier. The 10-Q gives no explanation. It could reflect conservative reserving on new AI rack systems, or a reliability problem. Either way, it is a question investors should put to management.
Earnings quality is deteriorating faster than peers
Dell's earnings quality score fell from 63 to 30 (out of 100) in two quarters, the 7th-largest decline among 72 tech companies. Against 22 hardware peers, it fell from 90 to 26.
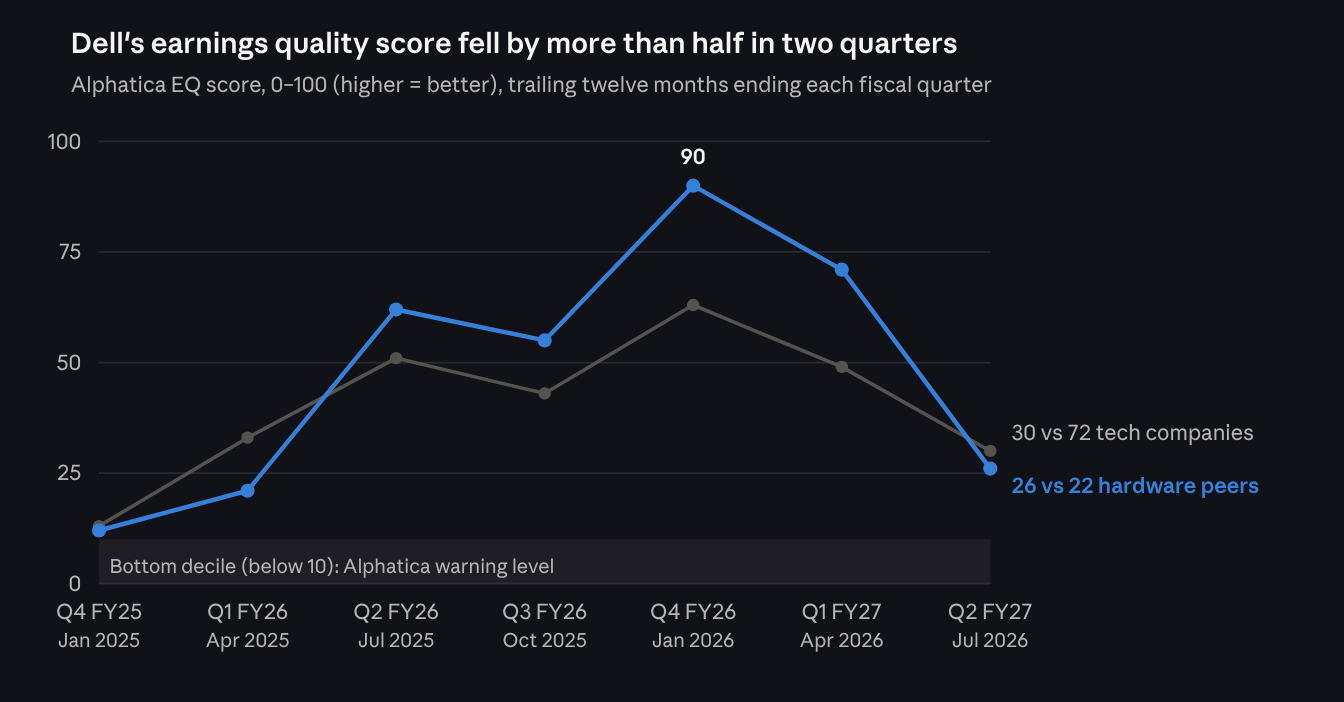
The Alphatica score is a proprietary composite of balance sheet and cash flow measures, ranked against 72 US technology companies. Scores run 0–100, and lower is worse. We treat a sharp quarter-over-quarter decline as a possible inflection point.
Dell is not yet at our warning level. The level is middling; the speed of the decline is the signal.
Dell now ranks in the bottom fifth of the peer group on the accrual and capital-intensity measures in the composite. Its other components sit mid-pack.
The score likely understates the problem. As the working-capital section shows, the payables surge offsets much of the receivables and inventory build, and equipment Dell leases to customers inflates its capital spending.
Our supplementary warning signs point the same way. Dell's rise in inventory days ranks at the 88th percentile of peers and its rise in receivable days at the 75th. Its finance leadership also turned over within the past 13 months: the Chief Accounting Officer stepped down in August 2025, the CFO resigned in September 2025, and the interim CFO was made permanent in November 2025. That followed a material weakness, disclosed in February 2025, over supplier credits in the PC business. We treat finance-leadership turnover alongside weakening earnings quality as a key warning combination.
A parabolic year, and who sold into it
Dell closed 2025 at $125.88 and peaked at $588.40 on September 17, a 367% gain in under nine months. At $456 it is still up 263% year to date. Through mid-August, only SanDisk had outperformed it in the S&P 500.
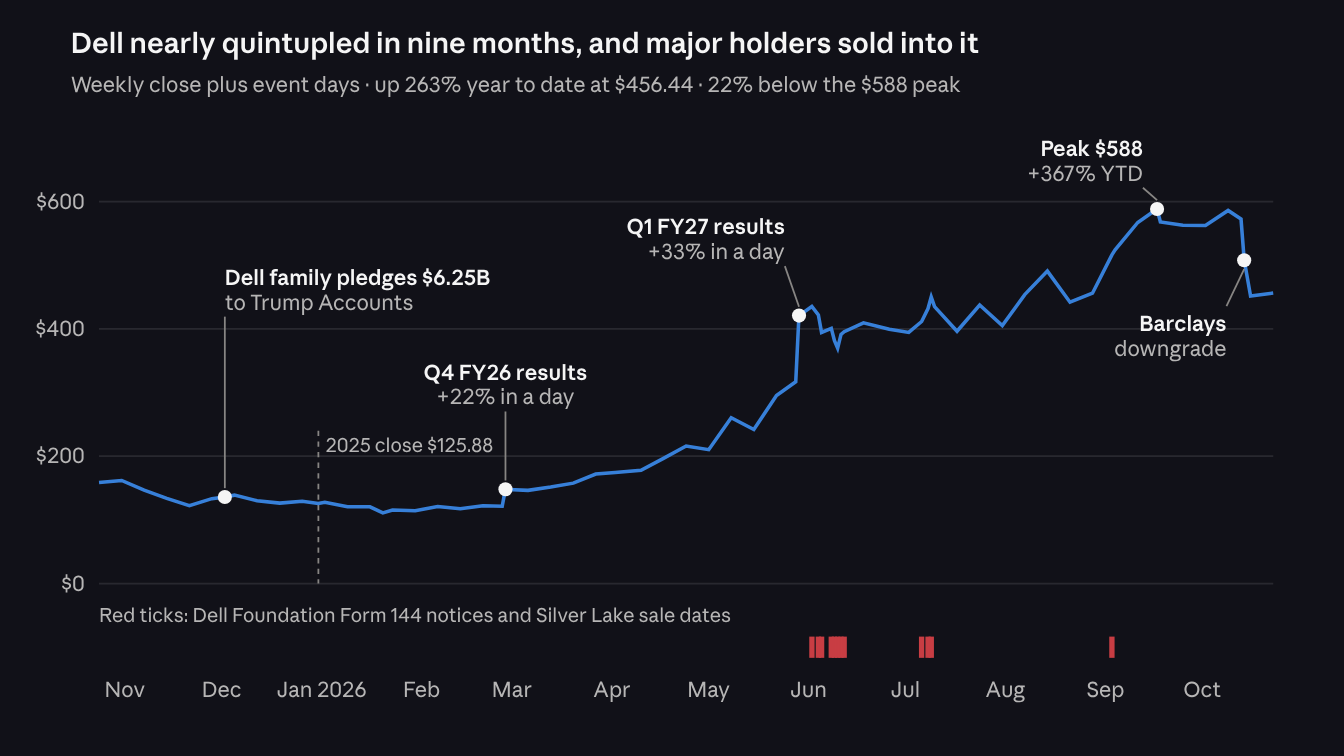
The run began with a founder in the headlines. On December 2, 2025, Michael and Susan Dell pledged $6.25B to seed "Trump Accounts," the new federal investment accounts for children. The gift puts $250 into accounts for about 25 million children aged 10 and under, focused on ZIP codes with median income below $150,000. Dell stock closed at $136 that day.
The pledge says nothing about Dell's business. But it made Michael Dell one of the most visible executives in the country just as the AI server cycle accelerated, and the stock became a crowd favorite. The earnings reports then did the rest: the stock jumped 22% the day after Q4 FY26 results and 33% the day after Q1 FY27 results.
The usual signs of a crowded long are now all present:
| Signal | Earlier in 2026 | Now |
|---|---|---|
| Shares sold short | 23.1M (Apr 15) | 12.3M (Sep 30) |
| Days to cover | 3.7 | 1.4 |
| FY27 EPS expectation | $12.90 (Dell guidance, Feb) | $25.90 (consensus) |
| Sell ratings | — | None |
The holders closest to the company have been sellers into the rally. The Michael & Susan Dell Foundation filed notices to sell about 2.7M shares on June 2 and about 2.5M shares on September 3, roughly $2.4B at those days' closing prices. The shares were gifts from Michael Dell. Silver Lake, Dell's private equity co-owner, sold at least $700M of stock in June and July alone.
Neither is alarming in isolation: foundations diversify, and private equity sponsors exit. The pattern is what matters. The sellers have been the best-informed holders, the buyers have been momentum, and the shorts have already covered.
The first crack came in mid-October. Barclays downgraded the stock on October 14, citing lagging enterprise AI adoption and revenue lifted by component prices. Dell fell 11% that day and about 18% for the week. With short interest this low, there is little forced buying left to cushion a second leg down.
What a turn would cost
A modest downturn would cost Dell about $2.50–5.40 of EPS and $5–7.5B of cash, before any drop in demand. Each exposure below is sized from the July 31, 2026 balance sheet; each is plausible on its own, and in a real downturn they arrive together.
| Exposure | Stress assumption | Pre-tax hit | EPS impact |
|---|---|---|---|
| Raw component inventory ($15.9B) | 10–20% write-down as memory prices fall | $1.6–3.2B | $2.00–4.00 |
| Lowest-tier customer loans ($4.4B) | 10–25% loss rate | $0.4–1.1B | $0.55–1.40 |
| Payables ($49.7B, 122 days) | Revert to 110–104 days as growth slows | $5.1–7.5B cash outflow | None (cash only) |
| Financing receivables gap | DFS debt stays at 47% of the book | $10.8B funded from the corporate balance sheet | None (cash only) |
EPS impact uses an 18% tax rate and 652M diluted shares. Against FY28 consensus of $29.93, the inventory and credit hits alone would cut EPS by 8–18% before any decline in volumes or pricing.
The cash side matters more. A payables reversion of $5–8B lands on a company with $11.6B of cash, $34.7B of debt and negative shareholders' equity, which has been spending more than $2.5B a quarter on buybacks. In a downturn, the buyback is the first thing to go, and the buyback is a large part of the equity story.
Cheap on peak earnings
At $456, Dell trades at 17.6x FY27 and 15.2x FY28 consensus EPS, which looks cheap only if this year's earnings are the new base. Consensus has normalized EPS rising from $10.30 in FY26 to $25.90 in FY27 (+151%), then to $29.93 in FY28.
The sell side is already split on FY28. Estimates for FY27 are tight, with a standard deviation of 2.5% of the mean. For FY28 they range from $16.39 to $36.47, a standard deviation of 13.5%. At least one analyst models EPS falling about 37% next year.
Holding today's 15x multiple on FY28 constant, the payoff is lopsided:
| FY28 scenario | EPS | Implied price at 15x | vs $456 |
|---|---|---|---|
| Bull (consensus high) | $36.47 | ~$547 | +20% |
| Base (consensus mean) | $29.93 | ~$449 | −2% |
| Cyclical downturn (consensus low) | $16.39 | ~$246 | −46% |
The downturn case may be generous on the multiple. Hardware peers HP Inc. and HPE trade at about 11–12x forward earnings, and a falling earnings base rarely earns a stable multiple.
The market has started to test this. The stock is 22% below its September peak, yet still trades as if FY27 earnings are a floor rather than a peak.
What would prove us wrong
The bull case is that demand stays ahead of supply long enough for Dell to convert its backlog, collect its loans and work down inventory before the cycle turns. There is real evidence for it:
- Demand is broad and contracted. Dell reports more than 6,500 AI customers, a $95B AI backlog, and about $132B of remaining performance obligations, 77% due within 12 months.
- Credit losses haven't appeared. First-half charge-offs were $30M, and loans 31–90 days past due fell from $195M to $132M. About 63% of the loan book is short-term.
- Guidance has been credible. Dell beat its own non-GAAP EPS guidance midpoint in 9 of the last 10 quarters.
- The accounting is clean. PwC, Dell's auditor since 1986, issued a clean opinion on FY26, and the 2025 material weakness was remediated. Non-GAAP adjustments are moderate: non-GAAP EPS exceeded GAAP by 20% or more in only 4 of the last 11 quarters.
- The PC business is steady. Client Solutions revenue grew 20% in Q2 with improving margins.
Our case does not rest on losses showing up yet. It rests on trajectory and concentration: every exposure is growing in the same direction at the same time, and each would amplify the others in a downturn.
What to watch
Fiscal Q3 FY27 results (quarter ending October 2026, reported late November) are the next test. Consensus expects normalized EPS of $6.56, below Q2's $7.04. Six readings would tell us whether the exposures are still building:
| Signal | Where it is disclosed | Bearish reading |
|---|---|---|
| Financing receivables and lowest-tier share | 10-Q, financing receivables note | Still rising; tier share above 21.5% |
| DFS debt vs receivables | 10-Q, DFS debt note | Coverage below 47% |
| Inventory and purchase obligations | 10-Q, supplemental info and commitments | Inventory above $21.3B with commitments growing |
| Payables vs inventory | Balance sheet | Payables flat while inventory builds |
| Warranty accruals | 10-Q, warranty note | Still elevated, or tied to product quality |
| Backlog language | Earnings call | Cancellations, "timing" or "customer readiness" delays |
Outside Dell, the key trigger is contract memory pricing. A flattening or decline in DRAM and NAND contract prices would hit Dell's selling prices before its inventory costs.
The broader triggers are an AI capex pause by neocloud customers or a credit event at one of them. Either would hit backlog, receivables and inventory at once.
Dell's AI boom is real, but its balance sheet is now levered to that boom on every axis at once: customer loans, inventory, supplier credit and purchase commitments. When the cycle turns, these exposures compound rather than offset.
At today's multiple, a cyclical downturn implies roughly 45% downside. The consensus mean implies a flat stock, and even the most bullish estimate implies only about 20% upside.
Fiscal calendar. Dell's fiscal year ends in late January or early February. FY27 runs February 2026 to January 2027; Q2 FY27 is May–July 2026.
Earnings quality score. The Alphatica score is a proprietary composite of balance sheet and cash flow measures, scored on a trailing-twelve-month basis and ranked against 72 US technology companies. Scores run 0–100; lower is worse. Component definitions and weights are not disclosed.
Stress test and valuation. EPS impacts use an 18% tax rate and 652M diluted shares. Scenario prices hold the 15x FY28 multiple constant against the consensus low, mean and high.
Sources.
- Dell Technologies Form 10-K for FY26 (filed March 16, 2026) and FY25; Forms 10-Q for Q1 FY26, Q3 FY26 and Q2 FY27 (filed September 8, 2026).
- As-reported financial statements, consensus estimates (as of October 24, 2026), short interest (settlement September 30, 2026) and market data.
- Dell earnings call transcripts, Q1 FY25 through Q2 FY27.
- Trefis, "What Changed For Dell Stock, And What Did Not?" (October 15, 2026)
- Pluang, Dell weekly decline coverage (October 16, 2026)
- CNN via KVIA, "Michael and Susan Dell donate $6.25 billion to fund 'Trump Accounts' for millions of American kids" (December 2, 2025)
- TipRanks, "Dell stock has nearly quadrupled in 2026" (August 2026)
- Dell Foundation Form 144 notices (June 2 and September 3, 2026) and Silver Lake Form 4 filings.
Disclosures. At the time of publication, the author and Alphatica hold no position, long or short, in DELL.